given a tree with an id and and toid in the first and second columns, returns a sorted and potentially split set of output.
Can also be used as a very fast implementation of upstream with tributaries navigation. The full network from each outlet is returned in sorted order.
get_sorted(x, split = FALSE, outlets = NULL)Arguments
- x
data.frame with an identifier and to identifier in the first and second columns.
- split
logical if TRUE, the result will be split into independent networks identified by the id of their outlet. The outlet id of each independent network is added as a "terminalID" attribute.
- outlets
same as id in x; if specified only the network emanating from these outlets will be considered and returned.
Value
data.frame containing a topologically sorted version of the requested network and optionally a terminal id.
Examples
source(system.file("extdata/new_hope_data.R", package = "nhdplusTools"))

fpath <- get_tocomid(
  dplyr::select(new_hope_flowline, COMID, FromNode, ToNode, Divergence, FTYPE,
                AreaSqKM, LENGTHKM, GNIS_ID)
)

head(fpath <- get_sorted(fpath, split = TRUE))
#> Simple feature collection with 6 features and 10 fields
#> Geometry type: LINESTRING
#> Dimension:     XY
#> Bounding box:  xmin: 1505349 ymin: 1554873 xmax: 1508920 ymax: 1558708
#> Projected CRS: +proj=aea +lat_1=29.5 +lat_2=45.5 +lat_0=23 +lon_0=-96 +x_0=0 +y_0=0 +ellps=GRS80 +towgs84=0,0,0,0,0,0,0 +units=m +no_defs
#> # A tibble: 6 × 11
#>     comid tocomid  fromnode    tonode divergence ftype areasqkm lengthkm gnis_id
#>     <int>   <dbl>     <dbl>     <dbl>      <int> <chr>    <dbl>    <dbl> <chr>
#> 1 8898302 8896658 250110375 250032382          0 Arti…    0.152    0.182 "98382…
#> 2 8896658 8896656 250032382 250032381          0 Stre…    1.19     1.37  "98382…
#> 3 8896656 8896624 250032381 250032375          0 Stre…    3.86     2.64  "98382…
#> 4 8896664 8896624 250110182 250032375          0 Stre…    1.38     1.64  " "
#> 5 8896624 8896570 250032375 250032361          0 Stre…    1.34     1.17  "98382…
#> 6 8896572 8896570 250110161 250032361          0 Stre…    1.56     1.77  " "
#> # ℹ 2 more variables: terminalID <int>, geom <LINESTRING [m]>

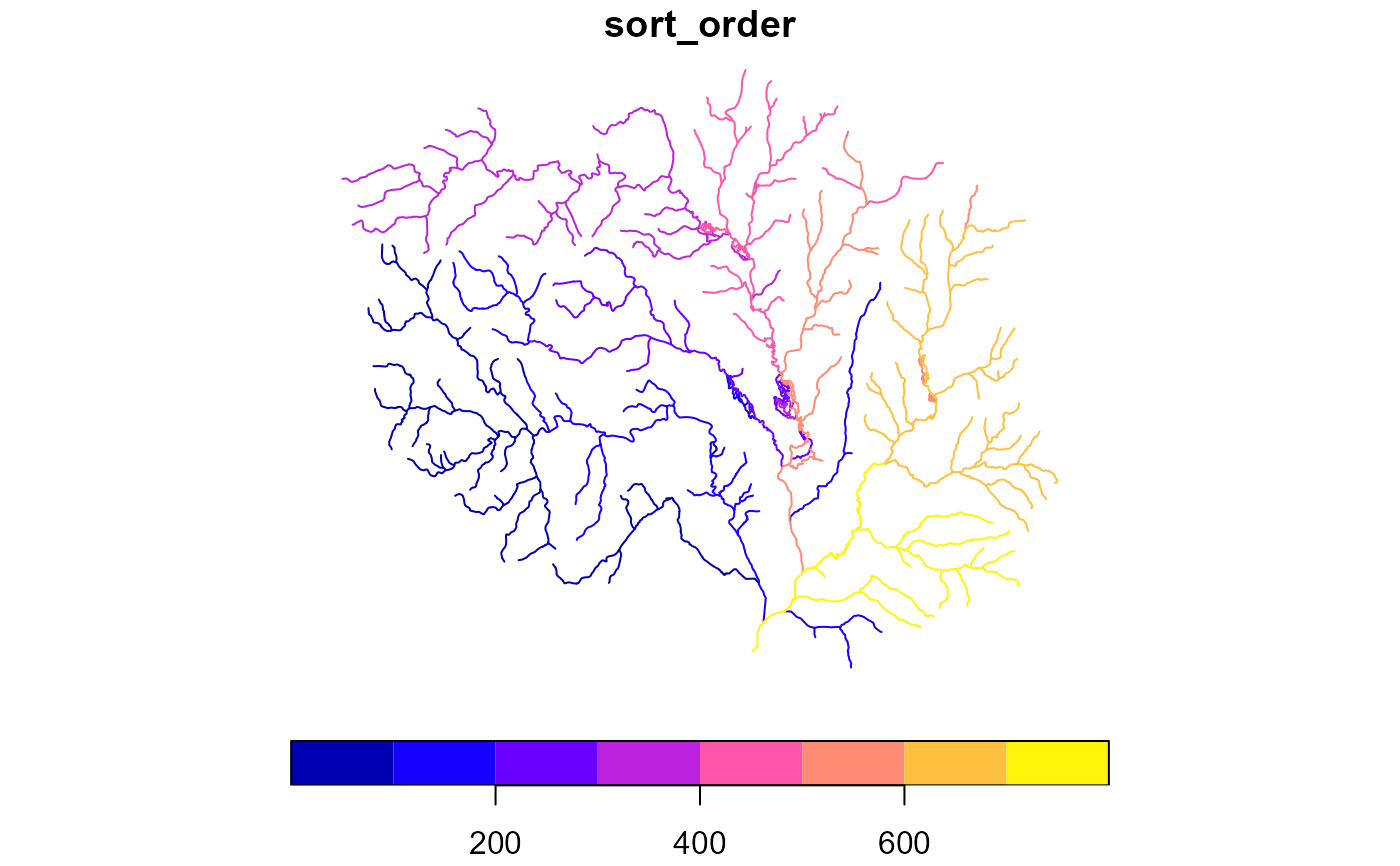
fpath['sort_order'] <- 1:nrow(fpath)

plot(fpath['sort_order'])
